WORKSHOPS | CREATIVE FUN
Get those creative juices flowing
Portfolio
Portfolio
CORPORATE & GROUP EVENTS ON TEXEL
Morale lifting and fun
Malou Zuidema
Illustrations
Informatieve visualisaties Educatie materiaal
My work is suitable to translate factual information into comprehensible and engaging images. Can be used for research results, colorful diagrams and scientific figures. As to captivate a wider audience and inspire them to get involved.
Scientific graphs · Poster design · Presentation Visuals · Outreach Projects · Science for Kids


Wageningen University & Research
A diagram for a research proposal about ecological effects of large scale sand extraction
This diagram is used as part of a larger research proposal. To visualise and communicate how the different research roles and elements are interconnected and related. Making sure the image visually communicates this information to audiences from a different scientific fields.

KNVM
Logo ontwerp en gedenkplaquette
This diagram is used as part of a larger research proposal. To visualise and communicate how the different research roles and elements are interconnected and related. Making sure the image visually communicates this information to audiences from a different scientific fields.


Easter Covid Promotional Card
A diagram for a research proposal about ecological effects of large scale sand extraction
Promotional card as part of a Dutch Easter treat sent to all employees from the NIOZ. Delivered with a typical Dutch 'paasbrood'. Validating the harsh Covid times.
The designs shows one Easter egg with the NIOZ logo, and a baby seagull happily emerging, as a sign of better times will come.
Also used as part of an external outreach to partners.

Global Ocean Observing System (GOOS)
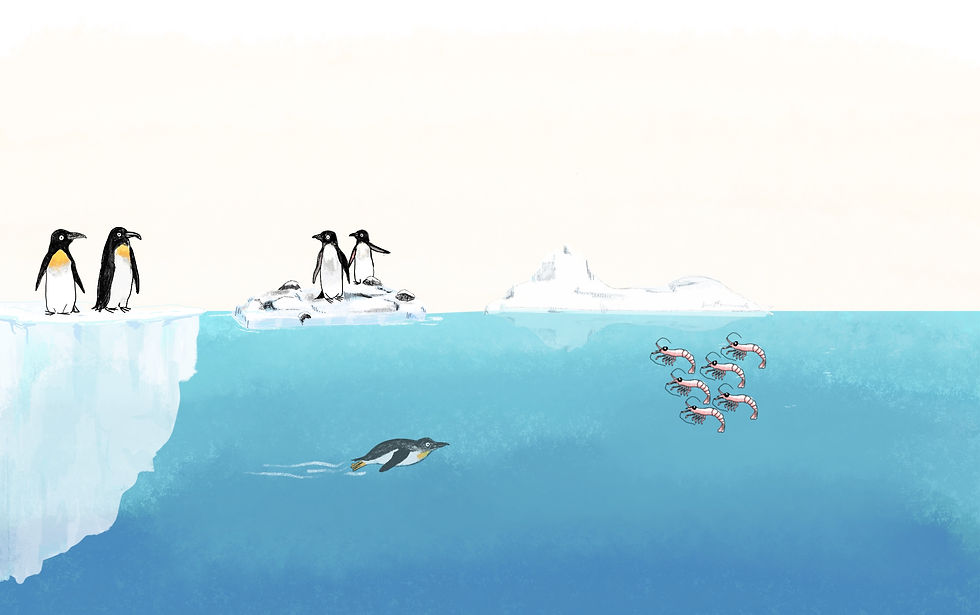
Whale poo research
A collaboration with Dr. Lavenia Ratnarajah, who is an ecologist and biochemist for Global Ocean Observing System (GOOS)
Creating a diagram for a research paper about the Southern Ocean, talking about Antarctic ice and nutrient transport.
The figures shows different groups of penguins, living on ice and on a rocky island. With krill and a swimming penguin.
As well as multiple spot illustrations to use as part of prentational material and other outreach purposes.

University of New South Wales
Graph design - Water mass transformation
A graph that illustrates the processes in that influence water mass transformation. Looking at how a bit of water in the ocean can change; think about influences like heat, water density, carbon, oxygen, and more. This helps scientists to better understand the ocean.
This graph is used as part of presentations and has been published as part of a scientific paper.
For the experts: "In an abstract way, water mass transformation is a form of ocean circulation, but instead of using “location” as a property, we use a tracer as property. This trick provides completely new description and insights into the movement of these properties through the ocean".

Showing Australians Sustainable Development Goals

Graph specified per goal
Showing Australians Sustainable Development Goals
CSIRO Hobart
Graph UN SDG: Life Below Water
Graph as part of an article written by a group of early career researchers. Talking about current and future problems which cover the conservation and sustainable use of oceans, seas and marine resources. Meeting three of the UN sustainability Goals.
Published in 'Encyclopedia of the UN Sustainable Development Goals. Life Below Water'


University of Tasmania
Poster design for course Promotion
Humans: Earth Shapers is a course at the University of Tasmania. And talks about how humans are a force of nature, and whether we’re causing the 6th mass extinction. The course involves geology, environmental science, philosophy and law.
I was asked to develop a promotional poster, and course materials specific to the content, resulting in poster design, infographic and website banner.
For this science communication and outreach project I collaborated directly with the scientist and lecturer.
Poster Design for University course
Graph UN SDG: Life Below Water
Natural Hazards and Disasters course promotion poster for a multi-disciplinary course at Utas:
This unit is of broad interest to those who will have decision-making and crisis and communications responsibilities in both public and private sectors, with a place-based focus on Tasmania.
For this science communication and outreach project I collaborated directly with the scientists and lecturer. With the goal to include actual scenarios and local situations that would be discussed as part of the course.